Author: 系统管理 Time:2022-07-25 19:26:39 Read:2619
Quantitation of the Lateral Orientational Order within Various Grades of Kevlar High Strength Fibers with X-ray Linear Dichroism Microscopy
A. P. Smith, S. G. Urquhart, A. Garcia, and H. Ade,
North Carolina State University, Department of Physics.
The Problem:
Kevlar (registered trademark) is a high-strength, high-performance fiber manufactured by DuPont. It has specialty uses in bullet-proof vests, sporting equipment and tire reinforcement. The internal structure of the fibers is highly complex and not completely understood, despite the fact that the fiber has been in production for over 20 years. One particular aspect that has eluded determination is the degree of lateral orientation in the fibers. The molecules are believed to form sheets that "stack" themselves around the center of the fiber (like spokes in a bicycle wheel). This behavior has been observed in some grades of fibers but not all and has never been quantified. Using the dependence of x-ray microscopy on molecular orientation, we wish to try to quantify this lateral orientation.
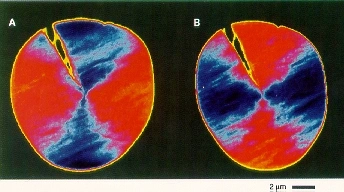
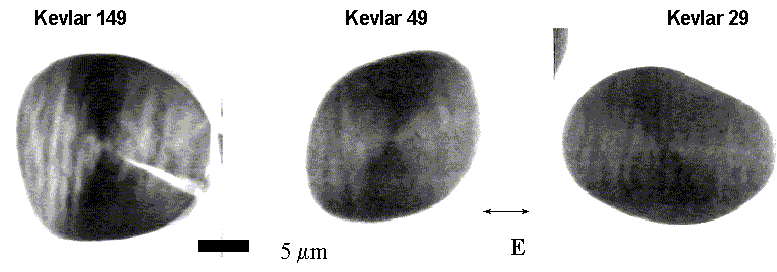
The Results: Our first goal was to determine whether or not x-ray linear dichroism microscopy could see the lateral orientation within the Kevlar fibers. To accomplish this, micrographs of the same fiber was acquired with the electric field vector of the x-rays rotated by 90 degrees. The micrographs are presented below (false color added to enhance effect).  This images show a Kevlar 149 fiber which was embedded in epoxy and sectioned to 200 nm thickness imaged at 285.5 eV x-ray energy. The electric field vector is in the left-right (A) and up-down (B) direction. The butterfly pattern observed appears in both images and rotates with the rotating electric field vector. This behavior is consistent with the expected x-ray dichroism of a radially symetric structure. For complete details of this observation see H. Ade and B. Hsiao, Science262, 1427 (1993). After this initial observation, we set out to determine if this orientation existed in all the various fiber grades and to quantify the degree. The first step was to acquire images from three different fiber grades, Kevlar 149, Kevlar 49 and Kevlar 29. Kevlar 149 is the strongest fiber and the most crystalline while Kevlar 29 is the weakest and the least crystalline. Below if the x-ray micrographs of the different fiber grades obtained at 285 eV.  |
Here the "butterfly" pattern is observed with decreasing intensity from the Kevlar 149 down to the Kevlar 29. The intensity of this pattern is correlated to the degree of orientation within the fibers and indicates that the Kevlar 29 is less oriented than the Kevlar 49 or Kevlar 149. This is the first direct observation of this behavior in the Kevlar 29 fibers.
The next step was to quantify the degree of orientation. To do this x-ray absorption spectra were acquired from within a fiber in two different places. This corresponded to the area where the electric field vector was perpendicular and parallel to the radial vector of the fiber (see inset to the figure below). The differences in the spectra are indicative of the degree of lateral orientation within the fibers and are shown below for both Kevlar 149 and 49 fibers.
By fitting the spectra peaks and extracting their intensities we are able to determine that Kevlar 149 is 1.6 and 2.3 times more oriented than Kevlar 49 and Kevlar 29 respectively. An absolute value for the orientation could not be determined here due to the complexity of the C K-edge spectra and the fact that the molecular functional groups do not lie in a plane. For more complete information on this procedure and these results please see A. P. Smith and H. Ade. Appl. Phys. Lett. 69, 3833 (1996)
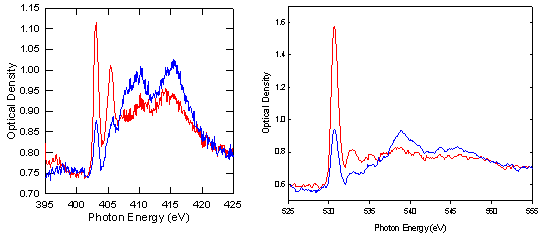
Our final goal was to determine values for the absolute orientation of the various Kevlar grades. In order to do this we utilized data acquired at the Nitrogen and Oxygen K-edges from the Kevlar fibers. For this data, the spectra are much simpler and the assignments more straight forward. The spectra acquired from the perpendicular (red) and parallel (blue) areas are shown below for the N K-edge (left) and O K-edge (right).
In addition molecular orbital calculations were performed to assist in spectral peak assignments. These calculations also yielded an approximate value of the angle the various functional groups make with one another. By utilizing this angle, we are able to calculate a correction factor for the values obtained at the C K-edge. These results as well as those for the N and O K-edge are presented below.
This table gives absolute values for the lateral oreintation within various Kevlar fiber grades. Inspection reveals that the N and O results are significantly higher than the C results, however, the C edge is much more sensitive to the correction factor than the other edges. The C edge data does correlate quite well with the observed strength values for the different fibers: Kevlar 149 = 1100 gpd, Kevlar 49 = 950 gpd and Kevlar 29 = 550 gpd. These results serve to show that the orientation of functional groups within a complex polymeric material at high spatial resolution is now possible.
A manuscript detailing these results is in preparation and not yet available. For more information click here to see a poster presented at the Workshop on X-ray Microscopy of Synthetic and Natural Polymers presented at NIST in May of 1998. This is a powerpoint slide presentation.
Copyright 1998 H. Ade. (single print-out excepted)
Created 12/29/98 by A. P. Smith. Last updated 12/30/98.
Skype: 349929921
Phone:13510421923
Tel: +86-755-83777378
Email: sales@iasun.cn
Add:A1-206,Hangcheng Chuangxin Chuangye Park,Hangcheng RD,Xixiang, Bao'an,Shenzhen,China.